Our team at DWP uses data to inform decisions and create policy based on the economic needs of local areas. We develop data products that answer policy makers’ questions, enabling their strategy and delivery.
Our work is open and crosses internal and departmental data boundaries.
But, let’s take a step back. Why did we develop these products? We know that policy work involves advising on and implementing appropriate action, which is a lot manual effort, iteration and is often done under intense time pressure.
Data can make this process easier. We combined interoperable data infrastructure, automated analytics pipelines and empathetic design patterns. This led to improved efficiency, consistency, raised data literacy levels and feedback loops, all which resulted in more informed decision making across government.
How have our data products helped?
Our tools provide answers to common, exploratory and data-heavy questions. For example, policy professionals will often need to know the highs, lows and extremes, the spread or range, whether any geographical inequality or hotspots exist for their topics. This all informs when, where, why and how to take action.
Churchill is one of our products that visualised open data drawn from the web to help answer questions. We previously blogged about it last year.
The visuals are carefully designed for place-based policy. For example, the integrated barcode and map view helps answer initial questions, which can prompt further targeted research.
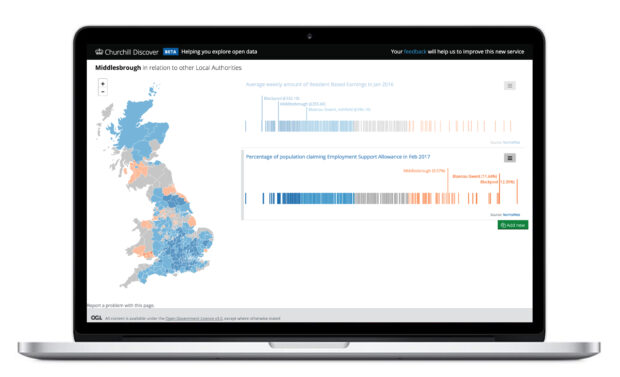
Churchill easily allows users to answer the question ‘What is the trend in this area?’ and also to compare with trends in other areas. But not all questions can be answered by thoughtful data visualisation design.
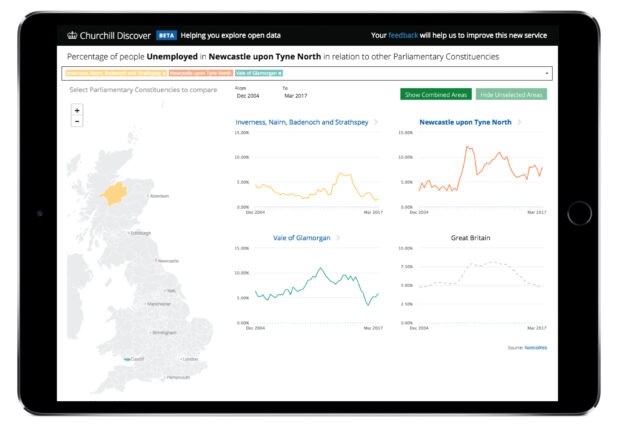
A common next question is “Which areas have similar trends?”. However, answering this requires more complex statistical and algorithmic methods.
Over the last year, we have been developing analytics pipelines which work across different data to answer questions like this automatically. We plan to embed these pipelines into our products.
How did the team develop?
When I began in this role I had no team! Now, there are about a dozen of us who collaborate our expertise, shared vision and right attitude to create great data products.
Over the first six months, I was joined by Gayll, Stuart, Stephen and Becky bringing backgrounds in data, technology and analysis. They have expertise in data processes, sharing, modelling, ethics, statistics and platforms, plus amazing networks.
Joana and Daniel brought fresh perspectives via the government statistical and operational research intakes with skills in computer science, data analysis and academic research.
Nine months in, Alaine joined us as delivery lead and we got in a rhythm of work with Aswini and his software engineering team and later David and his test team. Most recently, Mary brought long awaited user research expertise and Pablo joined us bringing deep computer science skills and a private sector perspective on ways of working.
Our ways of working are aligned more to software development than analysis. In this way we deliver regular, incremental improvements to meet user needs within sprints of work.
Our work crosses boundaries
Our work supports one of DWP’s objectives, as well as the Industrial and UK Digital strategies.
We are open and talk about our work. This means other organisations and departments, such as the Open Data Institute, want to work with us and support initiatives like Digital Skills Partnerships and Skills Advisory Panels.
We are committed to working across boundaries on data - internal and across government.
The Office for National Statistics are working to improve data infrastructure and develop reusable patterns for interactive visualisations. The GOV.UK registers team are working to improve data for services. This bodes well for our users as these teams are keen to work with us.
The future looks positive. I hope to grow my team soon and I’ve also got an exciting project planned for the summer, watch this space.
Subscribe for future blog updates.
Recent Comments